Overview
Spoken numbers are easy to miss, and building a chart in another tool means exporting a static image that you have to redo every time the data changes. AI Charts keeps that work inside Elai and keeps the result editable.
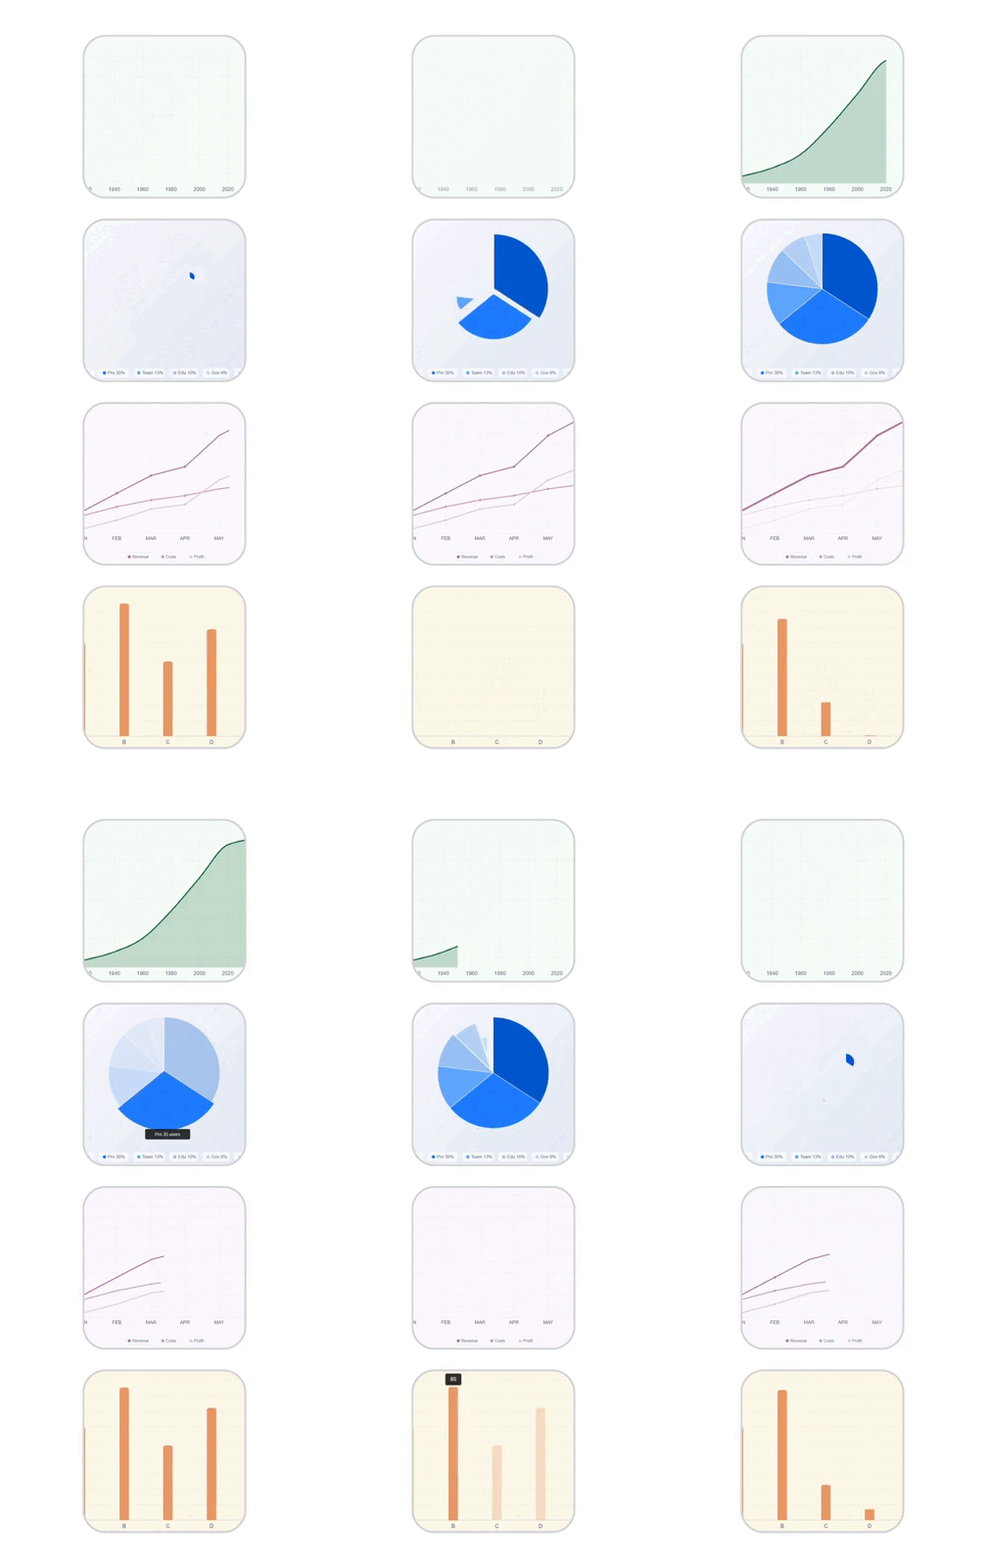
AI Charts generates animated charts directly from your slide content. Elai can read the numbers from the speech text of the slide you are working on, or build the chart from a prompt you write yourself. You can also combine both.
The chart is added to the slide as a native element rather than an uploaded image. It animates during playback, appears in your rendered video, and stays editable, so you can recolor it, adjust its animation speed, or rework its contents at any time without leaving Elai or rebuilding it from scratch.
Prerequisites
Enterprise subscription
Generating a Chart in the Editor
The Charts tab sits in the editor sidebar, alongside Avatar, Text and Elements. Open it with a slide selected.

1. Select Charts in the editor sidebar.
2. Leave Use speech text switched on to chart the numbers written in that slide's speech text, or switch it off and write your own prompt instead. 3. Select Add prompt to describe the data yourself
Note: If you mention a category but don't give the numbers behind it, that category is left out of the chart.
Note: If your prompt and your speech text give different numbers, the chart uses the numbers from the prompt.
4. Choose a starting point from the example prompts if you prefer: Compare values, Before & after, Show trend, % breakdown or Completion rates.
5. Set Primary color, Text color and, if you want a filled chart area, switch on Background and set Background color.
6. Select Generate.
If two chart types fit your data equally well, Elai shows both options under Choose a type. Select the preview that best matches your slide, or select Return to generation to adjust your prompt first.

A title is added above the chart as editable text in the language of your slide, along with a subtitle where one applies.

Supported Chart Types
Bar: grouped, stacked, and 100% stacked.
Line: including area charts, and two axes when your data uses two different units.
Pie and donut: for showing how a total splits into parts.
Note: Pie percentages are rescaled to total 100.
Note: When your data cannot be charted reliably, Elai explains why instead of drawing a misleading chart. For example, this can happen with mixed units on a bar or pie chart, two different currencies, or timelines with no numbers attached. Adjust your prompt or your speech text to resolve it, then generate again.
Editing and Regenerating Your Chart
Select a chart on the slide to open its settings in the sidebar.

- Colors: recolor each series or slice, the text and the background, or switch the background off to make it transparent. Your Brand Kit colors and video colors are available in the color picker.
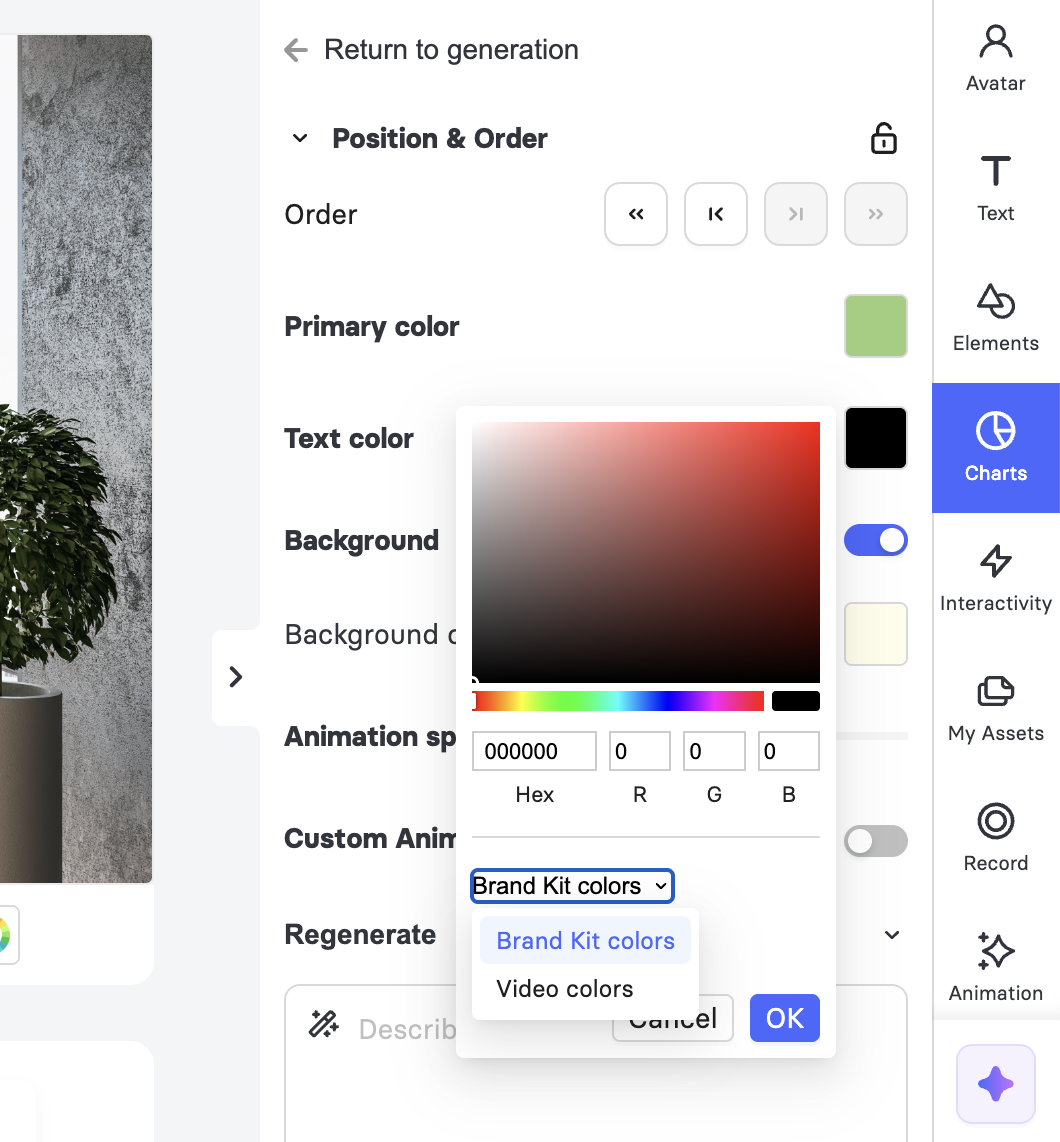
- Animation speed: set playback anywhere from 0.25x to 3x. The usual slide entrance and exit animations are available as well.
- Regenerate: type the next prompt into the Describe how to edit chart field, for example "make it a line chart", "hide the gridlines" or "show percent of total".
Note: Each regenerate request is handled on its own. Undo returns the chart to its previous state.
Note: Regenerate does not change the title and subtitle, as those are separate editable text elements.
Important! Charts resize proportionally and cannot be rotated. The animation plays once and holds on its final frame.
FAQ
Can I generate a chart from an image or a CSV file?
Not currently. AI Charts accepts text input only, up to 10,000 characters, with tables up to 500 rows. Generating from images and CSV files is planned for a future release.
Why does my chart show different numbers than my narration?
When a prompt and the speech text give different figures, the chart uses the figures from your prompt.
Why did Elai decline to build my chart?
Elai does not produce a chart it cannot represent accurately. The most common causes are mixed units on a bar or pie chart, two different currencies in one chart, or a timeline with no numbers attached. Elai explains the reason so you can adjust your prompt.
Will my chart look the same in the final video?
Yes. Charts render in both 1080p and 4K using your most recent color and speed settings.
Was this article helpful?
That’s Great!
Thank you for your feedback
Sorry! We couldn't be helpful
Thank you for your feedback
Feedback sent
We appreciate your effort and will try to fix the article